Splunk
-
Record the output URLs of the resources are stored in the Simple Server Manager (SSM) Parameter store, go to the region for SSM parameter store where you’ve launched the stack.
- Cloudfront URL you must whitelist in the Amazon Connect application whitelisting setting.
-
Successful deployment of SAR application, confirm both
softphonecallreportandsoftphonestreamstatsevents are successfully ingested into Splunk HEC input via Kinesis Data Firehose.
Testing the deployment
- Make an outbound call from the Cloudfront URL, after 30 seconds you should start to see metrics flowing into Elastic Search/Kibana/Splunk
Splunk
- The
sourcetypefor the HEC data inputs for soft phone data should be set tosourcetype="aws:connect:ccp" - Run the following search command to check if
softphonestreamstatsare being ingested into Splunk:
sourcetype="aws:connect:ccp" | spath doc | search doc.agent=*
- Run the following search command to check if
softphonecallreportare being ingested into Splunk:
sourcetype="aws:connect:ccp" | spath report | search agent=*
- All CCP events can be viewed with simple search on the right index.
index=<index> sourcetype="aws:connect:ccp"
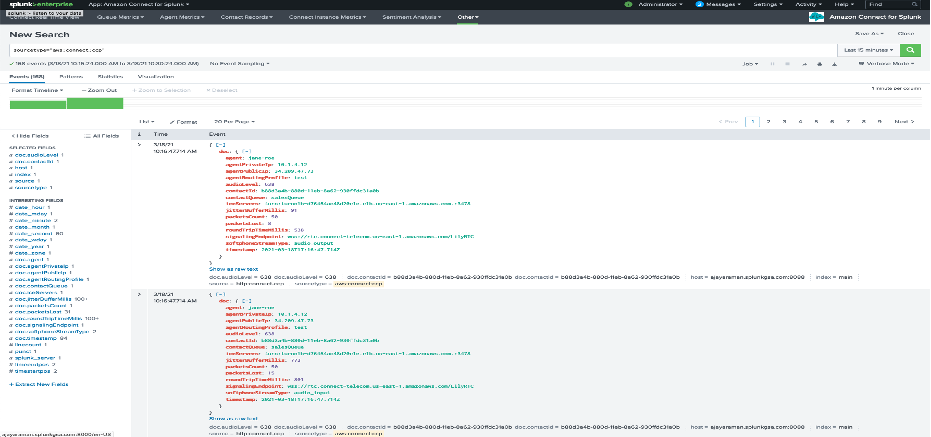
Splunk search interface
Using the dashboards
Splunk
Dashboards
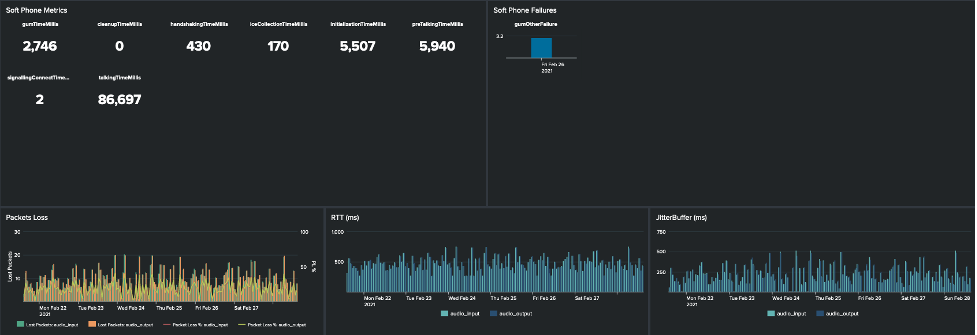
Under the Agent Metrics tab, the Agents Stats dashboard has a few panels. The panels use the soft phone call log report to generate these visuals. These reports are generated after termination of contact. There is one that displays the average of several soft phone metrics, count of soft phone errors, average packet loss and average packet loss percentage, round trip time (RTT) or latency and jitter buffer in milliseconds over time.
Splunk search interface
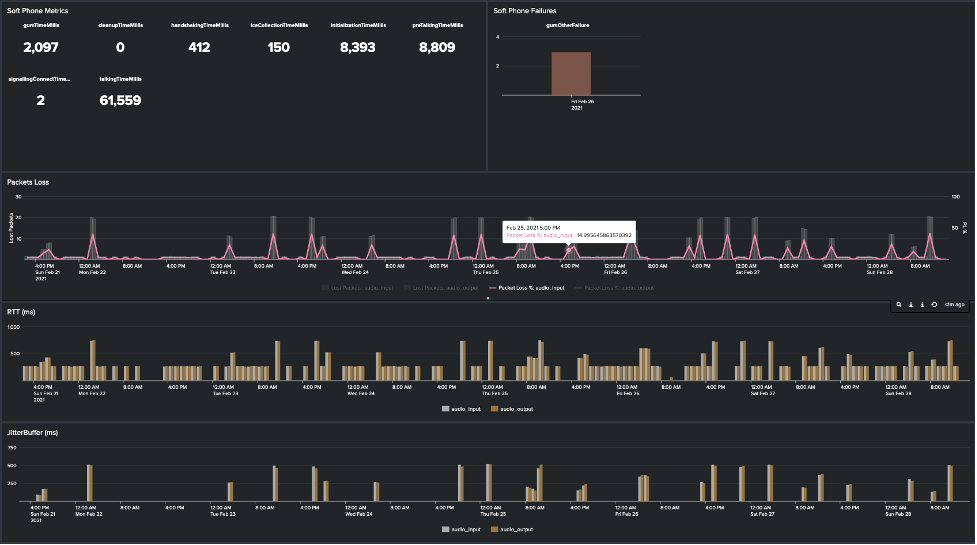
Under the Historical Report & Soft Phone Metrics tab, similar metrics as above can be viewed by agent. Agents’ can be selected from a dropdown list. These dashboards use both the soft phone call log reports and real time softphone stream statistics.
Splunk search interface
The connect real time view also has a panel that generates statistics to display geographic data and summarize the soft phone errors on maps.
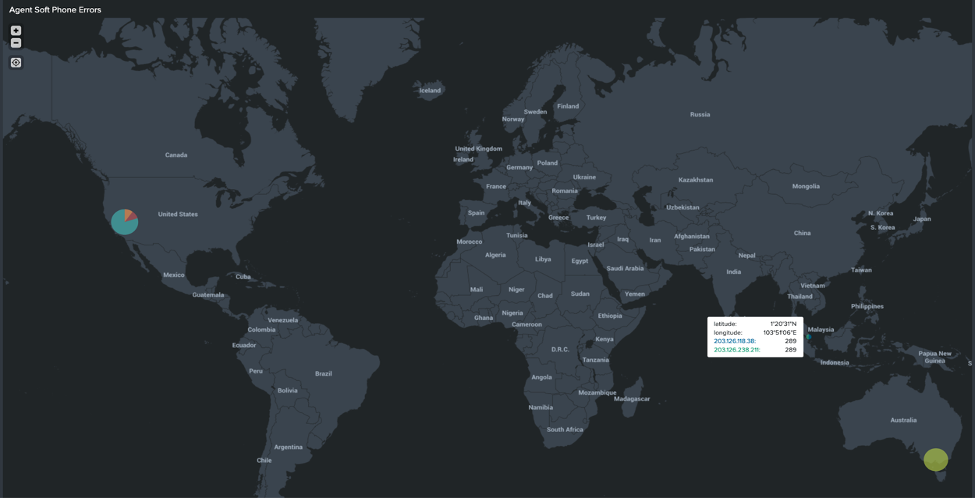
Splunk search interface
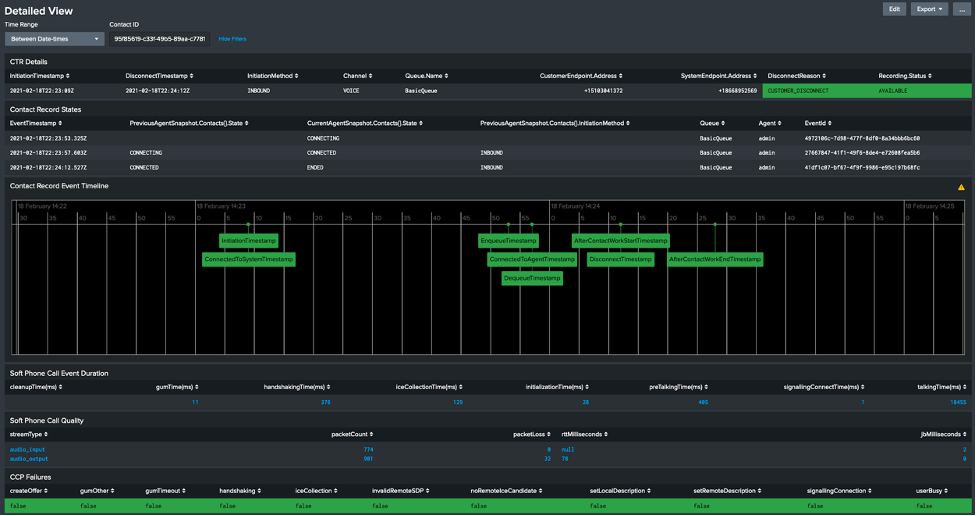
Soft phone call log report statistics by contact record are also available in the detailed view panel under the contact records dashboard.