Application Architecture
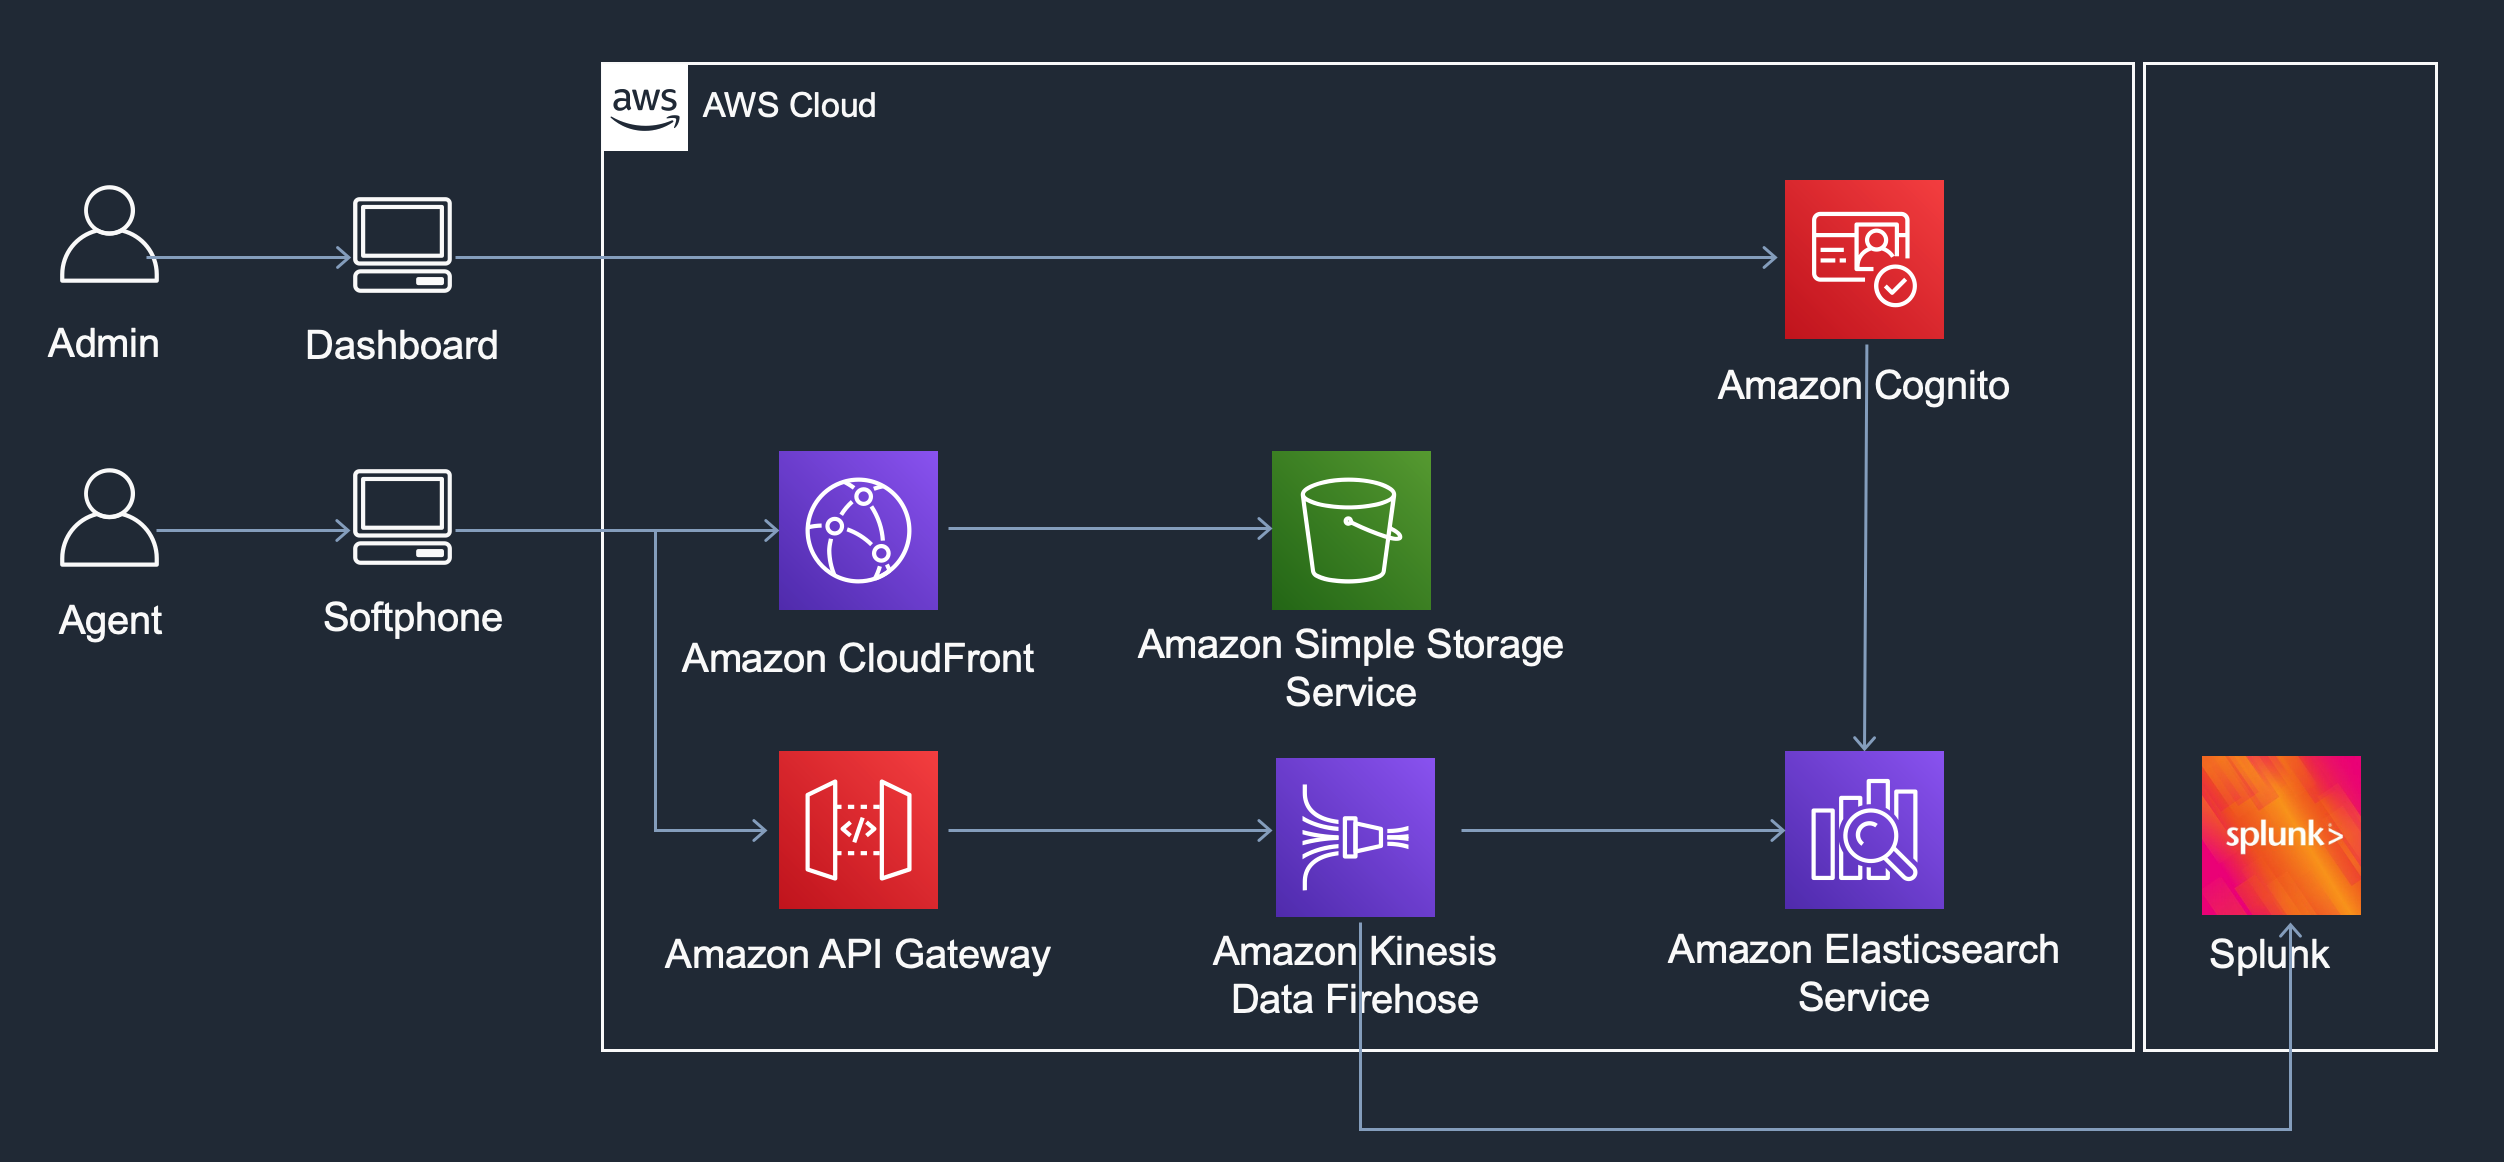
Frontend
The frontend of this solution is a custom static website which embeds the Amazon Connect softphone through an HTML element called an iframe. For more info on iFrames please refer to this. This iframe allows This custom webpage leverages two open source Javascript libraries to access the underlining WebRTC connection and collect the statistics.
Every 30 seconds, the custom website sends the data collected to an API Gateway endpoint. API Gateway forwards the data to your Lambda function and indexes the data into the Elastic Search cluster in your account.
The frontend consist of the following files
- connect-streams.js
- The Connect Streams library which allows you to create custom softphone implementations and consume service events like agent state changes and completed contacts.
- connect-rtc.js
- The Connect RTC library that allows you to interact with the underlying WebRTC objects.
- connect-custom-implementation.js
- The code used by this solution to use connect-streams.js and connect-rtc.js to collect softphone statistics, api latency statistics, and softphone call reports.
- It aggregates the metrics and sends to an API Gateway that is deployed in the SAR app.
- index.html
- The HTML for the custom softphone webpage. Sets the variables from the deployed solution (API Gateway URL, SAML URL, CCP URL) after being dynamically generated as part of a CloudFormation Custom Resource.
Amazon Cognito
Amazon Cognito User Pools are used to authenticate users and authorize access to the Kibana Dashboard. The CloudFormation Output has the URL to create users in the User Pool. You should create users for the people who require access to dashboards and operational data, for instance Call Center Managers or Operations Engineers.
AWS Lambda
AWS Lambda is used extensively throughout the solution to provide a serverless compute backend to bulk upload data to Amazon ElasticSearch. There are three Lambda functions that are core to the application, they are invoked by API Gateway.
- API Metric Pusher
- Uploads the TCP API latency data to Amazon ElasticSearch.
- Softphone Stream Stats Pusher
- Uploads the batched softphone stream statistics in a per agent, per contact, 30 second window to Amazon Elasticsearch. Enriches the data with contact specific information useful for dashboarding and troubleshooting. Uses the API Gateway External IP to add the agent’s public IP address to the data. WebRTC signalling information is cleaned and provided as well.
- Softphone Call Report Pusher
- Uploads the call report for a completed contact to Amazon ElasticSearch. Uses the API Gateway External IP to add public IP address to the data. WebRTC signalling information is also cleaned and provided.
Amazon API Gateway
Amazon API Gateway is the serverless API which communicates with the backend AWS Lambda functions using Lambda Proxy method requests. It restricts access using Cross-site request forgery (CSRF), specifying your custom streams distribution as the source. If you use a Custom Domain Name for your webpage, be sure to modify the CSRF restrictions.
Amazon CloudFront
Amazon CloudFront is the content delivery network used to serve our static web content. Agents can use the custom softphone by visiting the CloudFront URL.
Amazon S3
Amazon S3 stores the static files served by Amazon Cloudfront.
Amazon ElasticSearch
Amazon ElasticSearch is used as the search layer that allows you to perform complex searches over the collected quality metrics and call reports. Amazon ElasticSearch also comes with Kibana. Kibana provides a user friendly web interface for searching along with dashboards and alerts.
Dashboards are the critical feature enabling technical and non technical users to gain near-realtime insight into call quality issues. The solution creates dashboards enabling insights on a queue level, routing profile level, or on agent hierarchy. Users are able to modify existing dashboards and create new dashboards depending on their business needs.
The initial Kibana configuration is imported from the export.ndjson file as part of the CloudFormation stack. Modifications to the Kibana dashboard can be exported from Kibana, and this export can replace the export.ndjson retrieved from the solution artifact bucket if you wish to redeploy the Template after modification.
The initial ElasticSearch configuration uses 3 c5.large instances and 3 m5.large instances to enable high availability, node failure, rolling updates, and instance resizing.