Operations Guide
Elastic Search Operations
The initial ElasticSearch configuration uses 3 c5.large instances and 3 m5.large instances to enable high availability, node failure, rolling updates, and instance resizing. Depending your use case you may resize the Elastic Search cluster to suit your business needs. For more details please see the documentation here:
https://docs.aws.amazon.com/elasticsearch-service/latest/developerguide/sizing-domains.html
Index rotation
The solution creates daily indexes for the data that is inserted into the Elastic Search instance. These daily indexes allow you to move the data to more cost-effective storage such as UltraWarm for Amazon Elastic Search, or delete it altogether through index state management policies.
For more details on how to implement UltraWarm please find it here and more on index state management here.
This document covers UltraWarm storage andIndex State Management.
Cloudwatch Alarms
We recommend creating cloudwatch alarms different areas of the solution. For Elasticsearch please find the best practice guide here for creating Cloudwatch alarms.
Splunk
Here are some documentation on how to troubleshoot Kinesis Fire Hose + Splunk setup.
Troubleshooting
Elastic Search
This document describes how to identify and solve common Amazon Elasticsearch Service issues. Consult the information in this document before contacting AWS Support. https://docs.aws.amazon.com/elasticsearch-service/latest/developerguide/aes-handling-errors.html
Lambda
Below are useful resources to help troubleshoot AWS Lambda related issues:
This document describes how to monitor the Lambda function in the AWS Lambda console: https://docs.aws.amazon.com/lambda/latest/dg/monitoring-functions-access-metrics.html
This document describes the relevant AWS Lambda metrics in Cloudwatch Metrics https://docs.aws.amazon.com/lambda/latest/dg/monitoring-metrics.html
This docuemnt describes how to troubleshoot AWS Lambda functions by looking at the Cloudwatch Logs https://docs.aws.amazon.com/lambda/latest/dg/monitoring-cloudwatchlogs.html
API Gateway
The solution deploys an API Gateway and by defult it restricts access using Cross-site request forgery (CSRF). This is done by a CORS header configured in the Lambda functions.
If you use a Custom Domain Name for your webpage, be sure to modify the CSRF restrictions in the Lambda Function code. Specifically you would have to do this for all the Lambda functions:
- API Metric Pusher
- Softphone Stream Stats Pusher
- Softphone Call Report Pusher
Frontend
If you are not seeing data in the backend, please open the developer tools in your browser and open the network tab.
Google Chrome
- In the browser, at the top right, choose Customize and control Google Chrome.
- Pause on More tools, and then choose Developer tools.
- With DevTools open in the browser, choose the Network panel.
- Select the Preserve log check box.
- Choose Clear to clear all current network requests.
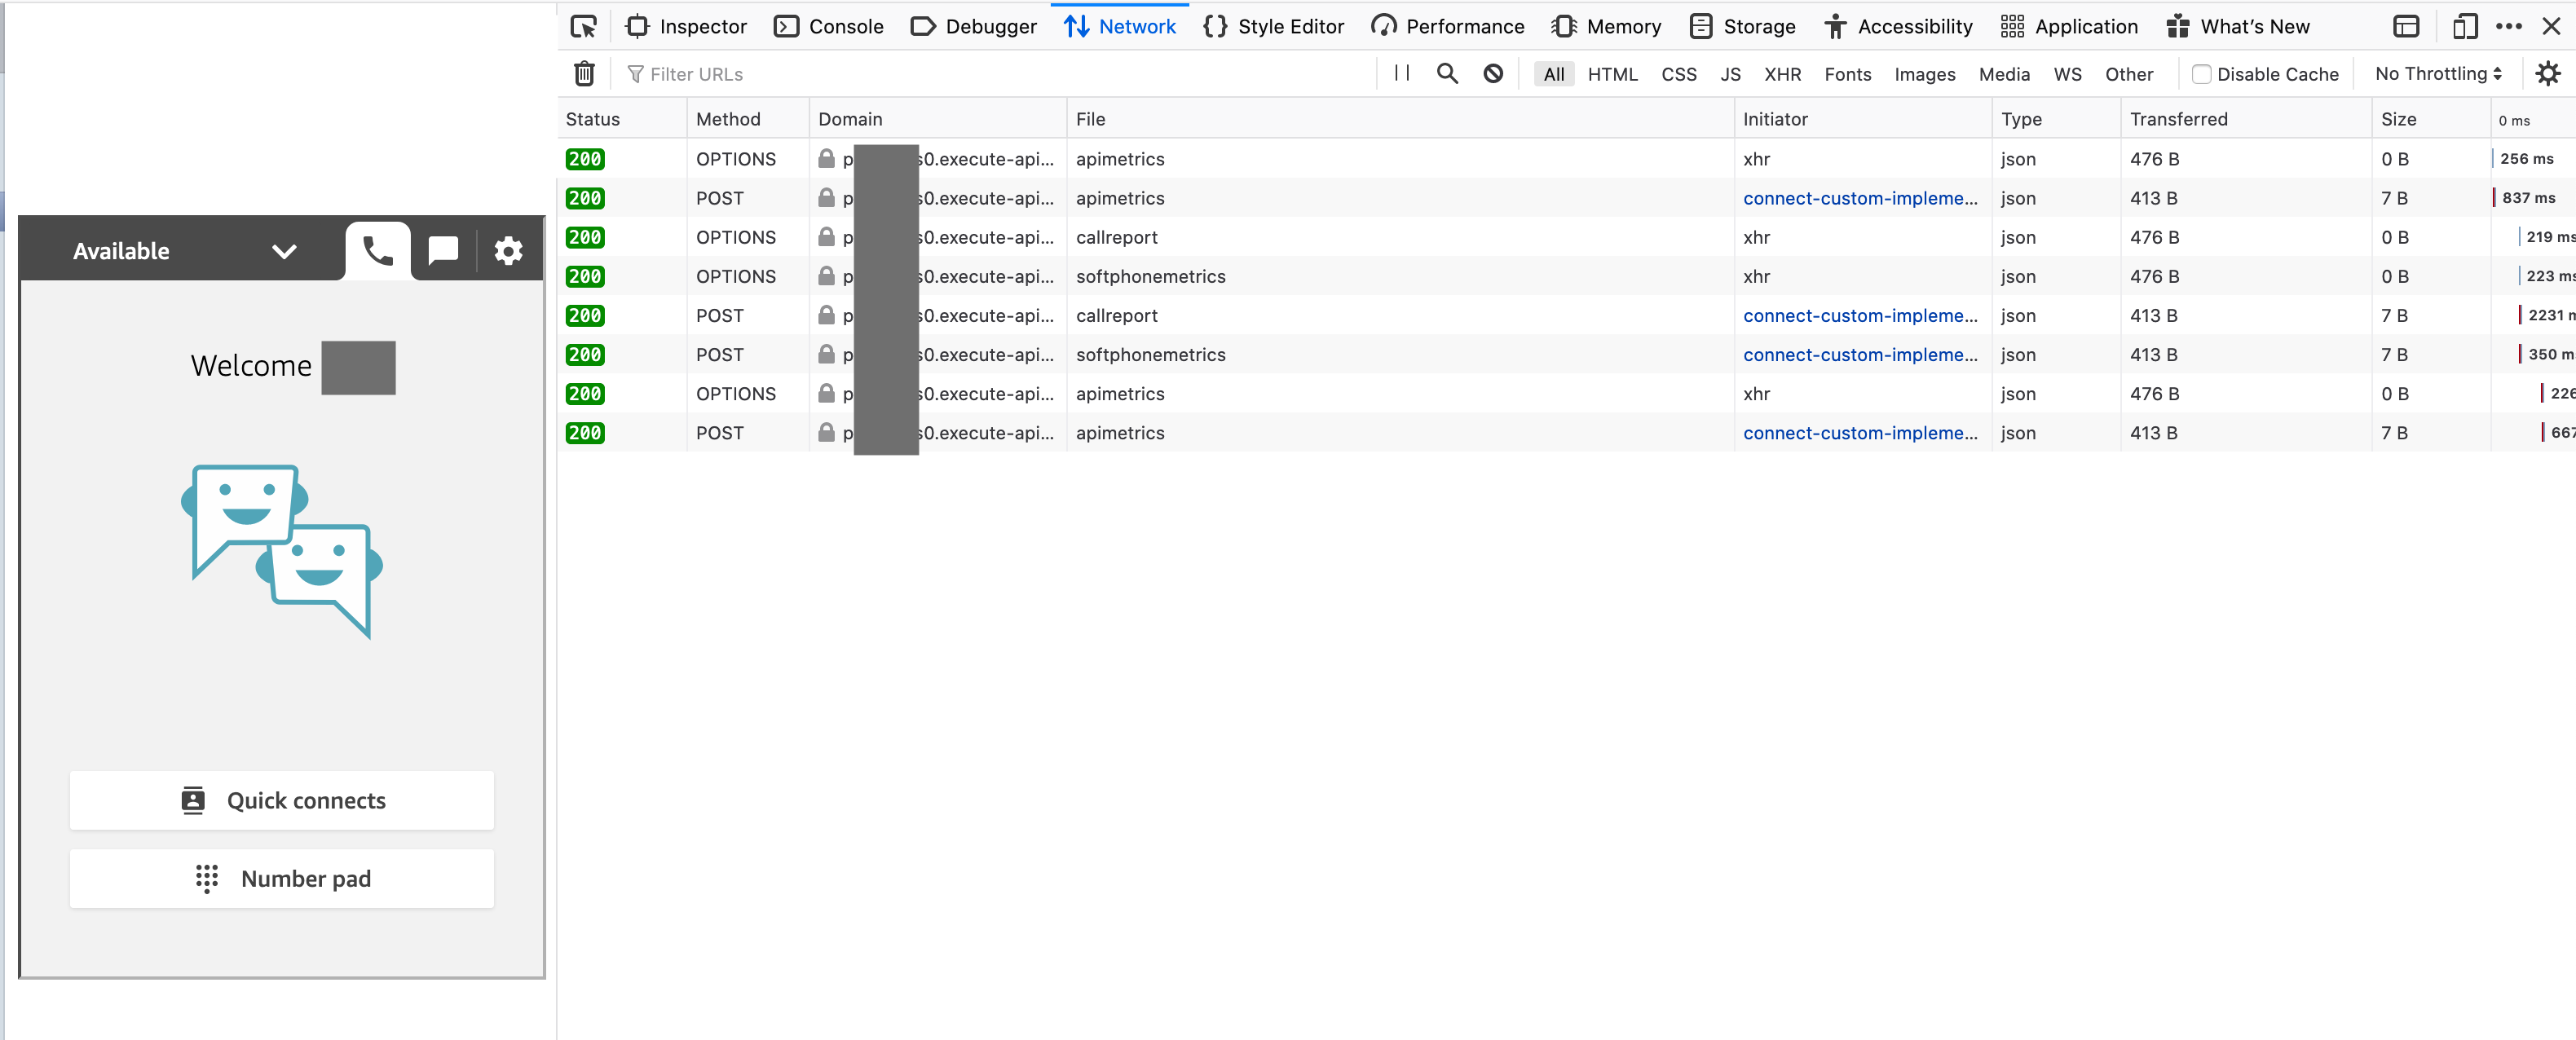
Mozilla Firefox
- In the browser, at the top right, choose Open menu.
- Choose Web Developer.
- In the Web Developer menu, choose Network. (In some versions of Firefox, the Web Developer menu is in the Tools menu.)
- On the Network Monitor, select the Persist Logs check box.
- Choose the trash can icon (Clear) to clear all current network requests.
Make a call using the CCP and look at the network request. If you see any row that is not 200, follow the network request through to the endpoint API Gateway and check the Lambda function logs.
For example, if the network request for “apimetrics” does not return 200, look at the Lambda function logs for the “API Metric Pusher“ function.