Amazon Connect Historical Metrics in Salesforce
Amazon Connect can generate a number of historical metric reports to monitor efficiency and utilization, agent performance, and other information about your contact center. Amazon Connect provides you the ability to schedule execution and export of reports, in comma separated value (CSV) format, to the S3 bucket of your choice. This enables broad compatibility across many analytics and WFM tools.
With the AWS Serverless Repository for Salesforce, you can configure the automatic import of reporting data from Amazon Connect into Salesforce. Two different historical reports are available to transport Agent and Queue interval data from Amazon Connect to Salesforce. Once these have been configured and scheduled, you will begin to see data available in the reports that have been included with the CTI Adapter.
Configuring the AWS Services
When you configure schedule reports to run in Amazon Connect, they are saved to your reporting Amazon S3 bucket upon execution. As a part of the schedule configuration, you can determine the frequency with which data is exported. The standard configuration is for execution every 30 minutes; however you can increase the interval time to suit your requirements.
Once you have the reports configured and scheduled, you will then need to activate the trigger for the reports bucket that will invoke an AWS Lambda function included in the AWS Serverless Repository for Salesforce. This function will process the report and import the data to Salesforce.
NOTE:
Each CTI adapter release will only be able to support a subset of all of the metrics available as new metrics are continuously being added by Connect after CTI adapter releases have already been released to the public.
When migrating from an older version of the CTI Adapter (At least earlier than v4.5), users may notice that ACSFCCP_HistoricalReportData is no longer being updated/populated. We have moved away from using this object but because Salesforce does not allow objects to be deleted, customers may still have these object types present in their Salesforce instance.
Configuring the Historical Reports in Amazon Connect
Login to your Amazon Connect instance as an Administrator
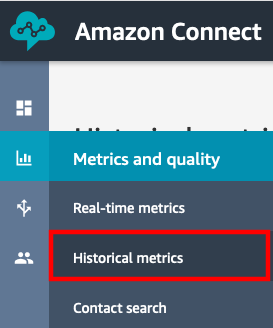
From the left navigation, choose Metrics and Quality then select Historical metrics
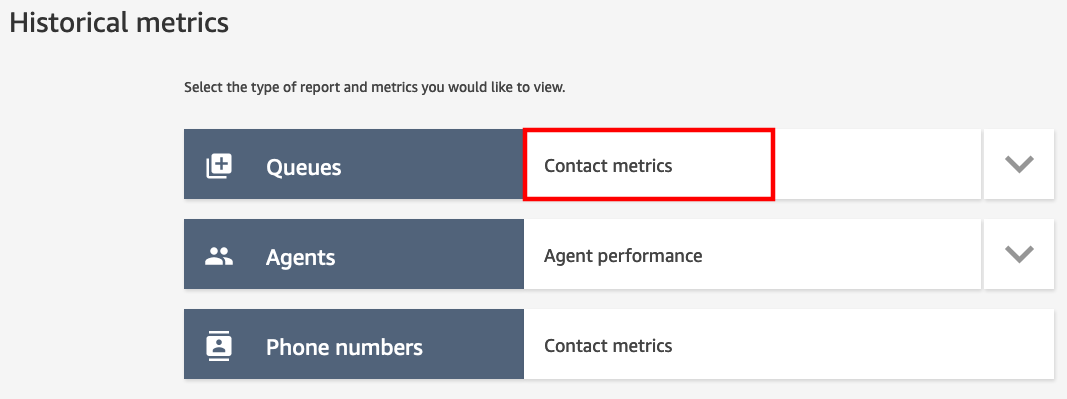
- On the Historical metrics page, select Contact metrics
Once the Historical metrics: Queues report loads, select the cog in the upper right to edit the report
On the Interval & Time range tab, set the parameters as follows:
a. Interval: 30 minutes
b. Time Zone: UTC
c. Time Range: Last 24 Hours
Leave the Groupings and Filters tabs set to their defaults
Select the Metrics Tab.
Select ALL selectable options
a. Note: With each release, we support a subset of the fields given. If you see an
INVALID_FIELDerror in your Lambda Cloudwatch (with the "Adherence__c" field for example), the selectable option for that field was most likely added after we released a new version.Select Apply
Once the report saves, select the dropdown menu next to the Save button and choose Schedule
Set the name as sfIntervalQueue and choose Continue
On the Note screen, choose Continue
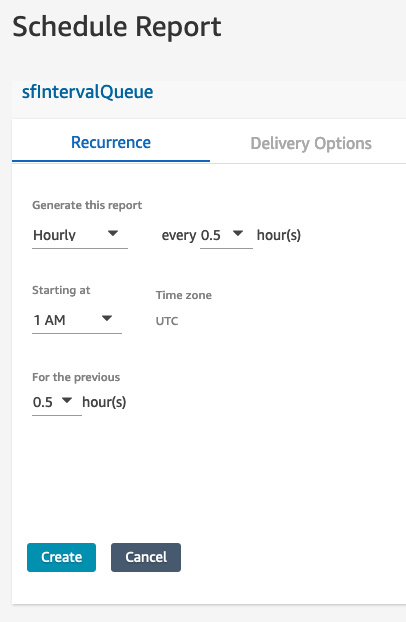
On the Recurrence tab in the Schedule Report setup, set the options as:
a. Generate this report: Hourly
b. Every: 0.5 hour(s)
c. Starting at: 1AM
d. For the Previous: 0.5 hour(s)
Select the Delivery Options tab
In the Prefix field, enter SFDC/Queue
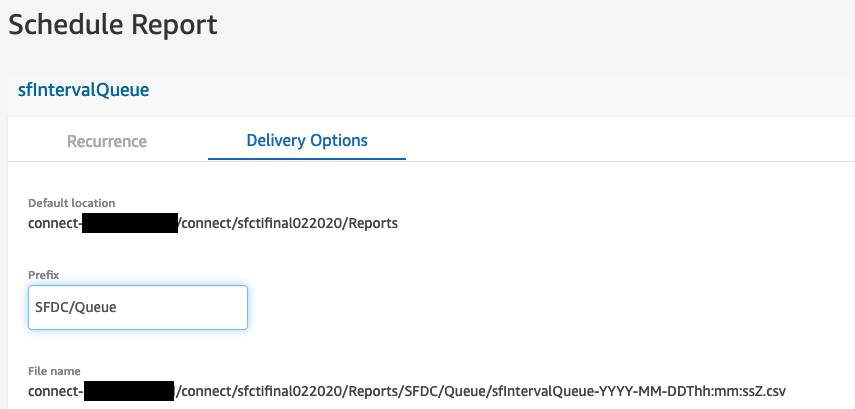
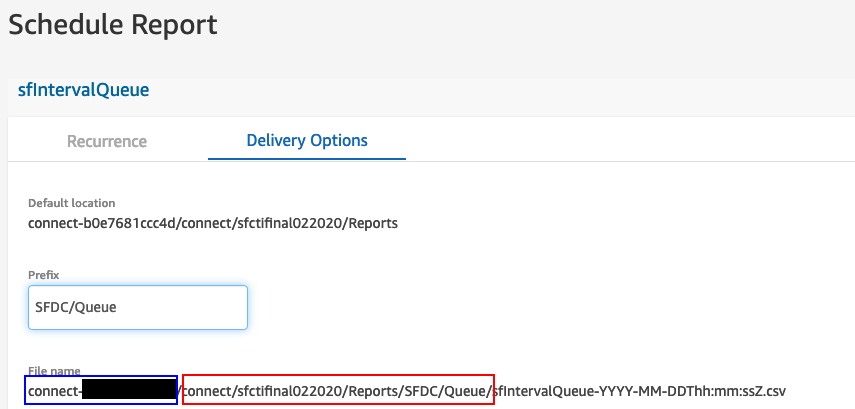
- Note the File name. The file name contains the bucket, path, and filename that will be used when executing the report. You will use the bucket name and path in later steps.
Choose Create
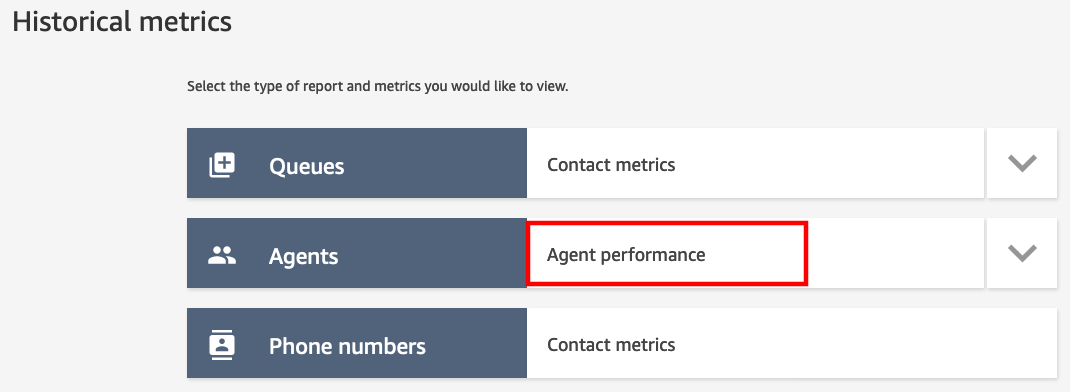
Once the report is created, from the left navigation, choose Metrics and Quality then select Historical metrics
- On the Historical metrics page, select Agent performance
Once the Historical metrics: Agents report loads, select the cog in the upper right to edit the report
On the Interval & Time range tab, set the parameters as follows:
a. Interval: 30 minutes
b. Time Zone: UTC
c. Time Range: Last 24 Hours
Leave the Groupings and Filters tabs set to their defaults
a. If you do decide to modify the groupings, be sure to keep Intervals as a grouping. We use this internally to categorize the reports on the Salesforce side
Select the Metrics Tab.
Select the following metrics (deselect any others):

Note You should be able to use all metrics, but these are the important ones.
-   After contact work time

-   Agent on contact time

-   Agent idle time

-   Non-Productive Time

-   Average after contact work time

-   Average handle time

-   Average customer hold time

-   Average agent interaction and customer hold time

-   Average agent interaction time

-   Contacts agent hung up first

-   Contacts handled

-   Contacts handled incoming

-   Contacts handled outbound

-   Contacts put on hold

-   Contacts hold disconnect

-   Contacts transferred out

-   Contacts transferred out internal

-   Contacts transferred out external

-   Error status time

-   Agent answer rate

-   Agent non-response

-   Occupancy

-   Online time

-   Agent interaction and hold time

-   Agent interaction time

-   Average outbound agent interaction time

-   Average outbound after contact work time
Select Apply
Once the report saves, select the dropdown menu next to the Save button and choose Schedule
Set the name as sfIntervalAgent and choose Continue
On the Note screen, choose Continue
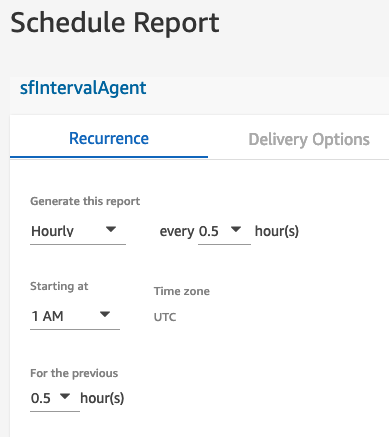
On the Recurrence tab in the Schedule Report setup, set the options as:
a. Generate this report: Hourly
b. Every: 0.5 hour(s)
c. Starting at: 1AM
d. For the Previous: 0.5 hour(s)
Select the Delivery Options tab
In the Prefix field, enter SFDC/Agent
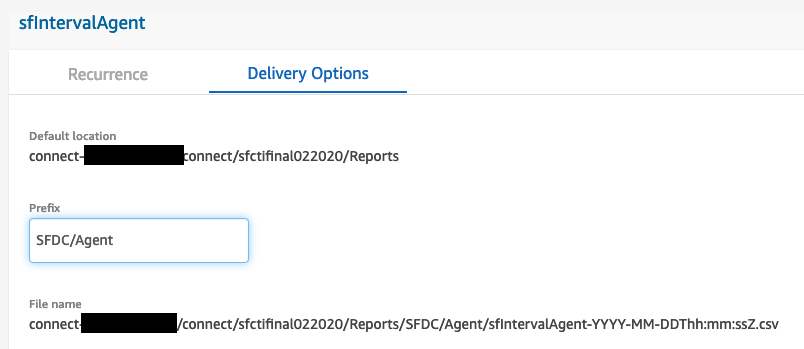
- Note the File name. The file name contains the bucket, path, and filename that will be used when executing the report. You will use the bucket name and path in later steps.

- Choose Create
Once you have created the two reports and set their schedule, the next thing you will need to do is to configure a trigger that executes a Lambda function when the report is generated and stored in S3.
Creating the AWS Lambda Trigger for the Queue Data
In a new browser tab, login to the AWS console
Open the AWS Lambda Console
In the Add filter field of the AWS Lambda console, enter sfIntervalQueue and press enter to filter the list of functions
Select the Lambda function that includes sfIntervalQueue in the name
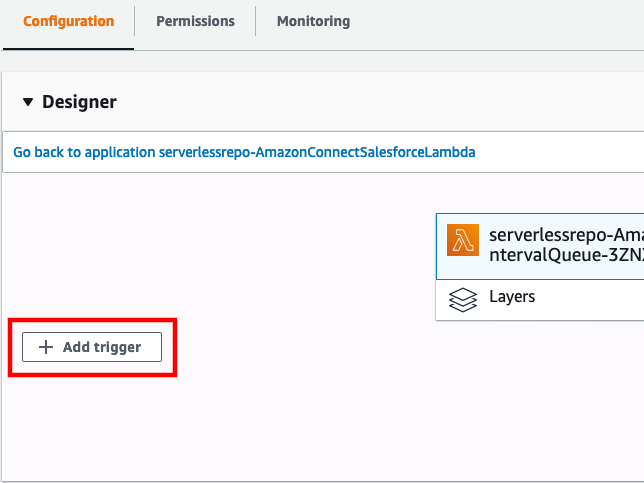
Expand the Designer section
Select Add trigger
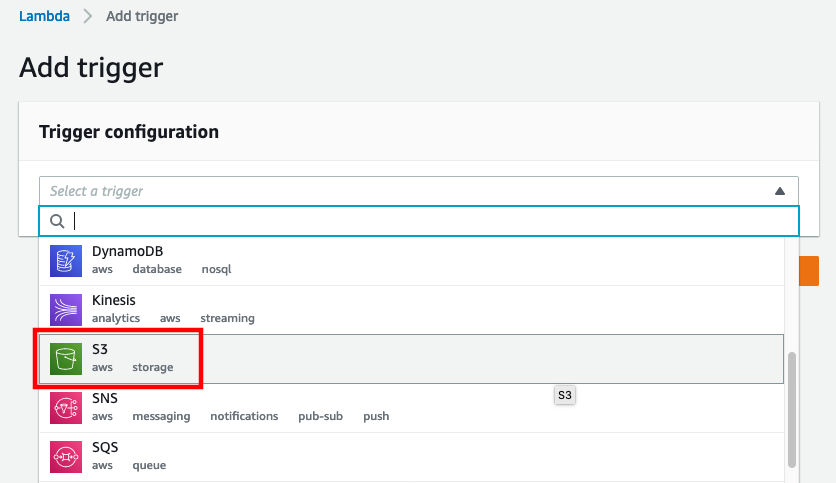
- In Trigger configuration, select S3 from the dropdown list
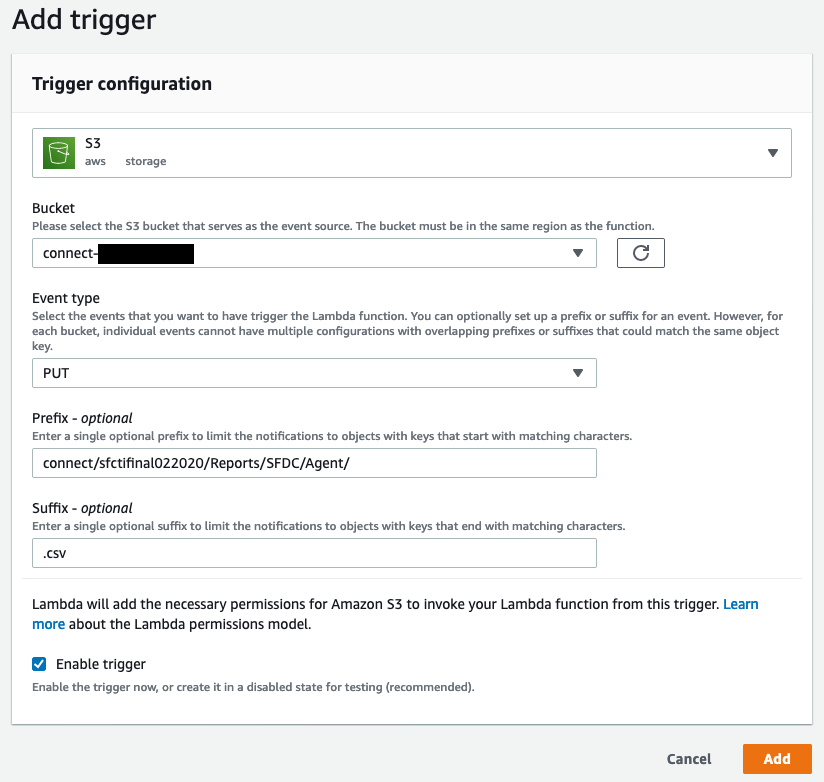
Referring to the notes from the report configuration earlier, select the appropriate bucket
Change the Event type to PUT
Referring to the notes from the report configuration earlier, set the Prefix to the path value for your report
Set the Suffix to .csv
The trigger configuration should now be similar to the following:

Select Add
If everything has been configured correctly, you should receive a success message.
Creating the AWS Lambda Trigger for the Agent Data
In a new browser tab, login to the AWS console
Open the AWS Lambda Console
In the Add filter field of the AWS Lambda console, enter sfIntervalAgent and press enter to filter the list of functions
Select the Lambda function that includes sfIntervalAgent in the name
Expand the Designer section
Select Add trigger
- In Trigger configuration, select S3 from the dropdown list
Referring to the notes from the report configuration earlier, select the appropriate bucket
Change the Event type to PUT
Referring to the notes from the report configuration earlier, set the Prefix to the path value for your report
Set the Suffix to .csv
The trigger configuration should now be similar to the following:
Select Add
If everything has been configured correctly, you should receive a success message.
Verifying the Data Import in Salesforce
Once you have configured the reports and added the triggers, you should start to see data in Salesforce after ~30 minutes. The Amazon Connect CTI Adapter comes with a predefined set of reports. These reports can be customized and additional reports can be created by leveraging the imported data.
Viewing Amazon Connect Reports in Salesforce
Log in into your Salesforce org and go to the Service Console
Expand the navigation menu by selecting the down arrow and choose Reports
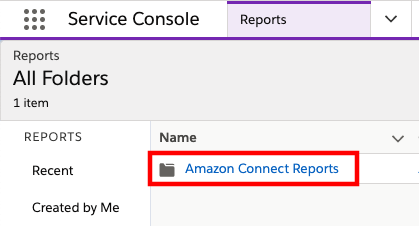
In the left Navigation, select All Folders
Select the Amazon Connect Reports folder
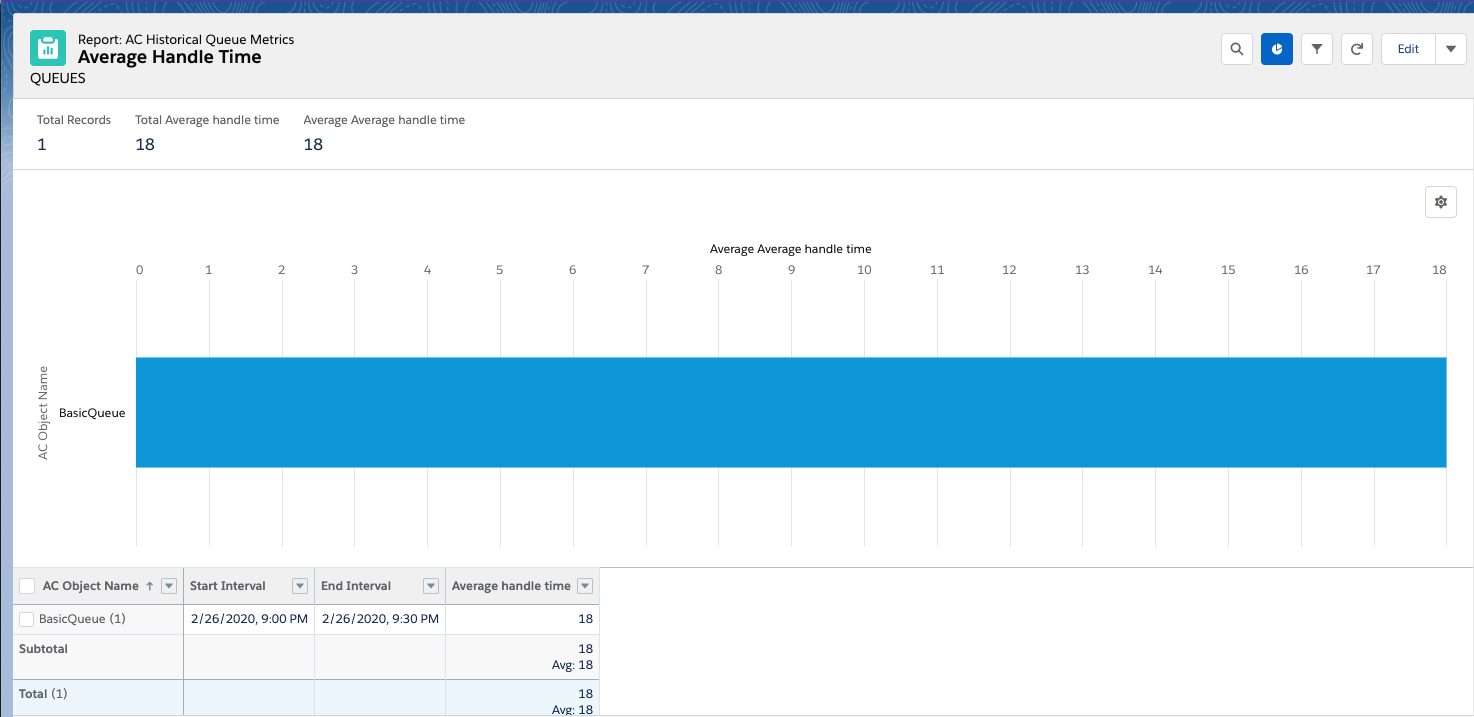
- In the list of reports, choose Average Handle Time queue report
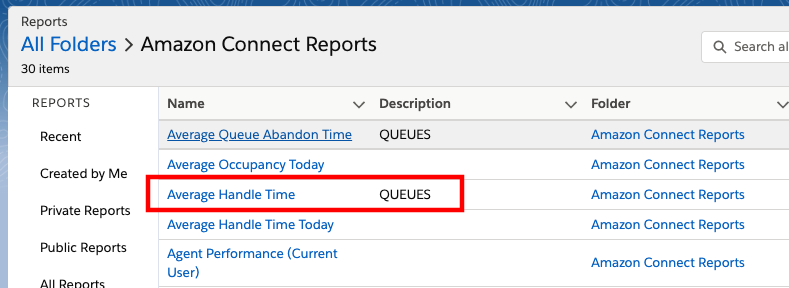
- Once the report loads, you should see data (provided calls have queued in this Amazon Connect instance today)